

Measure, record, and graph rain at home or in the classroom with easy-to-use printable monthly rainfall graphs.
Measuring rainfall amounts gives children a way to investigate their questions, one observation at a time. How much rain fell while you were sleeping? Did yesterday’s shower bring more rain than today’s downpour? Use a rain gauge and our printables to measure, record, and graph your findings to answer these questions and more!
Our printable Monthly Rainfall Graphs make it easy to compare the rain where you live. Or choose a location elsewhere in the world and use reported rainfall measurements to explore its weather from home or the classroom. Alternatively, compare the measurements you record in your rain gauge with official local measurement amounts. You can even compare and contrast your findings with what you discover in other locations worldwide.
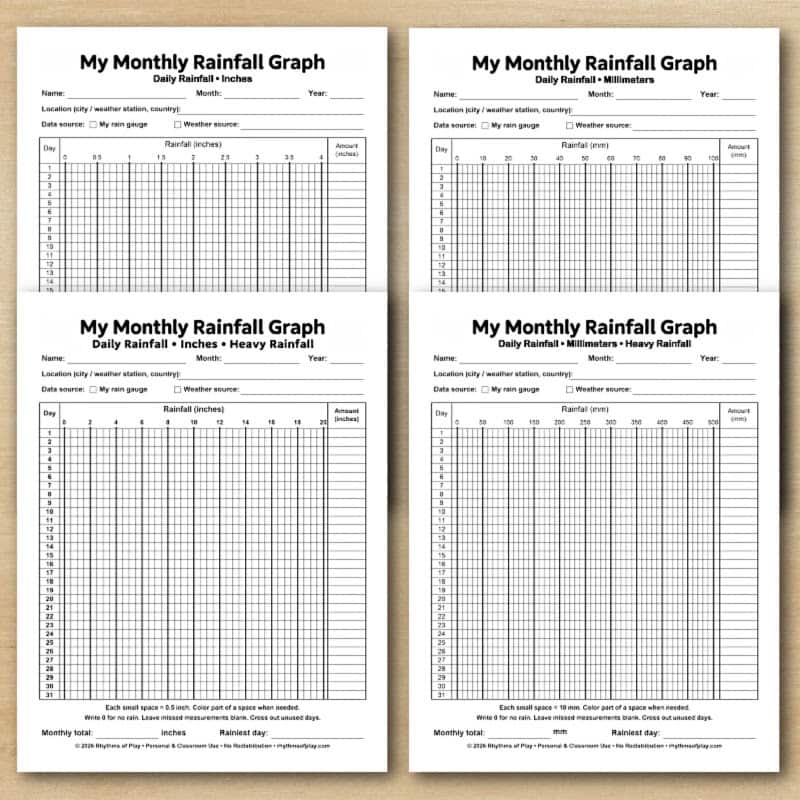
Each printable includes 31 daily rows, space for the location and data source, and a bar graph children can color as they record their observations. Choose inches or millimeters, then watch a month of measurements become a picture of the rain. Alternatively, you can record rainfall amounts in a nature journal. Or use both!
What Does a Rain Gauge Measure?
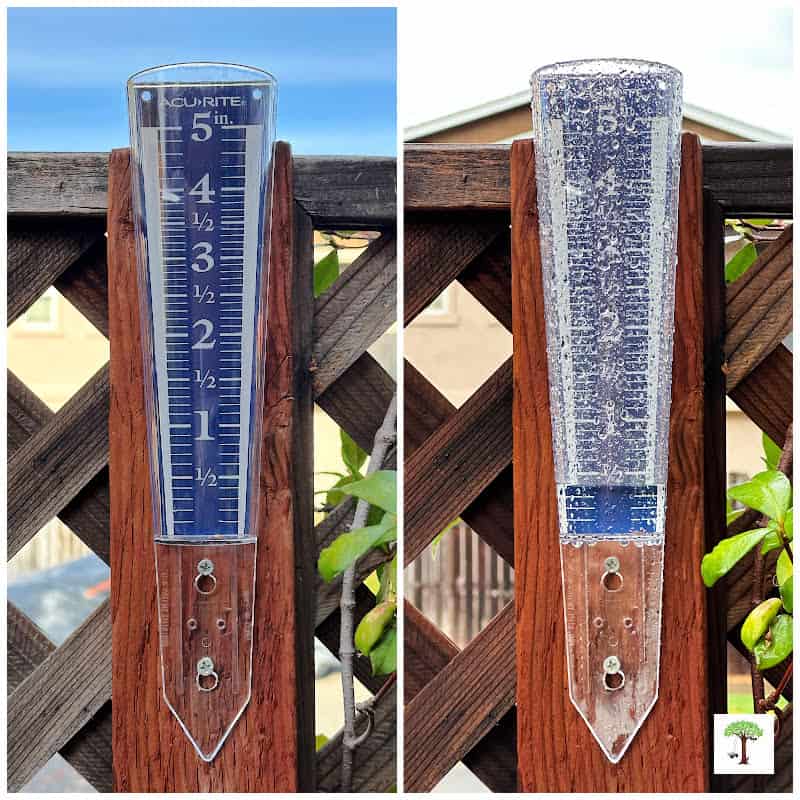
A rain gauge collects rain and measures it as a depth, usually in inches or millimeters. It helps answer: How much rain fell in this spot during a particular period? In the photo below, you can see ours with just under half an inch of rainwater, sitting at 0.4 inches, or the fourth mark up from the bottom of the tube.
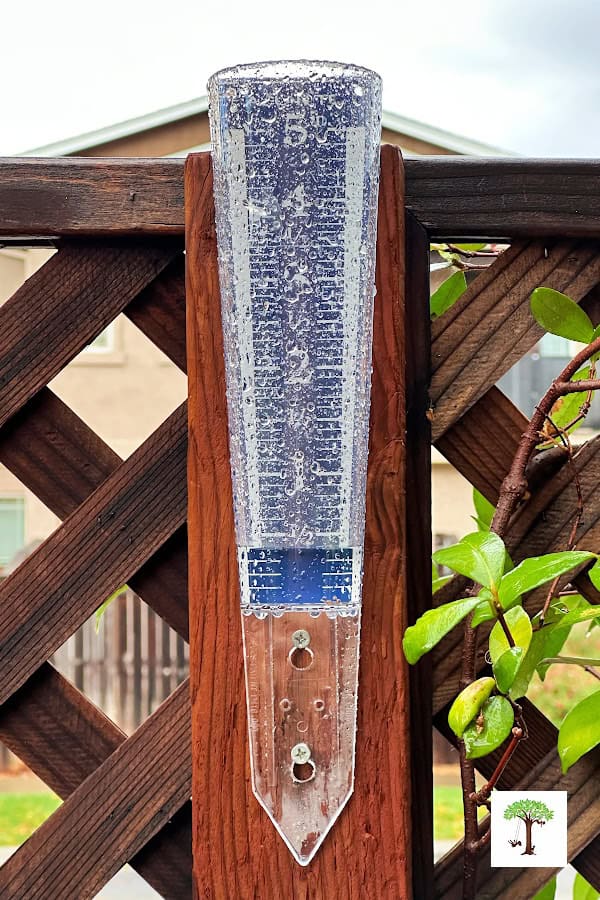
Read the rainfall amount using your gauge’s marked scale and instructions. Some gauges collect water through a wide opening into a narrower measuring tube, so the depth inside the tube is different from the rainfall amount shown on its calibrated scale, as shown in the photo above. Others use a rain gauge with straight sides and a standard ruler.
For this science activity, you will record the amount of rain collected every day, even when there is no rain. Pick a day and time when you can check it daily for best results.
Rainfall Measurement Supplies
To measure, record, and graph rainfall, you will need:
- A Monthly Rainfall Graph in inches or millimeters, or another place to record your measurements, such as a nature journal.
- Printer paper if you will be using the Monthly Rainfall Graphs.
- A pencil or pen for writing measurement details.
- Colored pencils or crayons to color the graph.
- A rain gauge, or access to reported daily rainfall measurements (Learn how to make your own below)
- A clipboard or firm writing surface, if desired.
Keep the graph indoors when it’s raining to keep it dry. A nature journal is a useful addition if you want to add extra notes about the weather, type of rain, observation times, and anything else you or your children notice and want to record. You will also need a three-hole punch if you’d like to add your printable rain graphs to a binder.
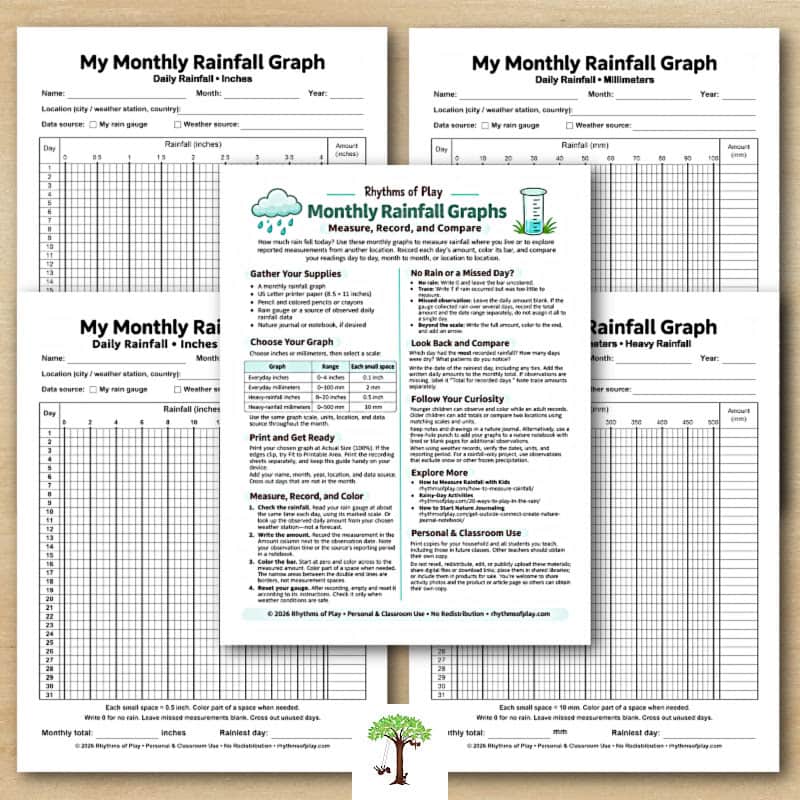
You can see the printable graphs and the instruction page in the image below.
Tips for Using the AcuRite 5-Inch Capacity Magnifying Acrylic Rain Gauge
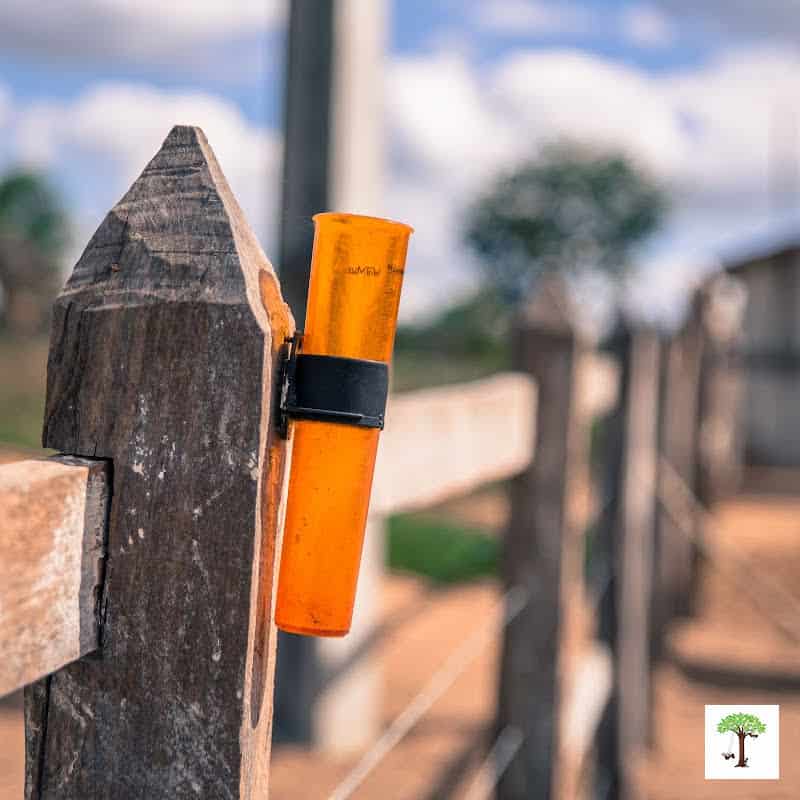
My family uses an AcuRite rain gauge with a 5-inch capacity to measure rainfall at home. It has white, magnified numbers for easier reading. You can stake it into the ground or mount it using the integrated hanger.
Either way, keep it upright, with the opening level and clear of overhead obstructions like a roof overhang or a tree. We have ours mounted on a fence post in an open spot, as shown in the photo below.
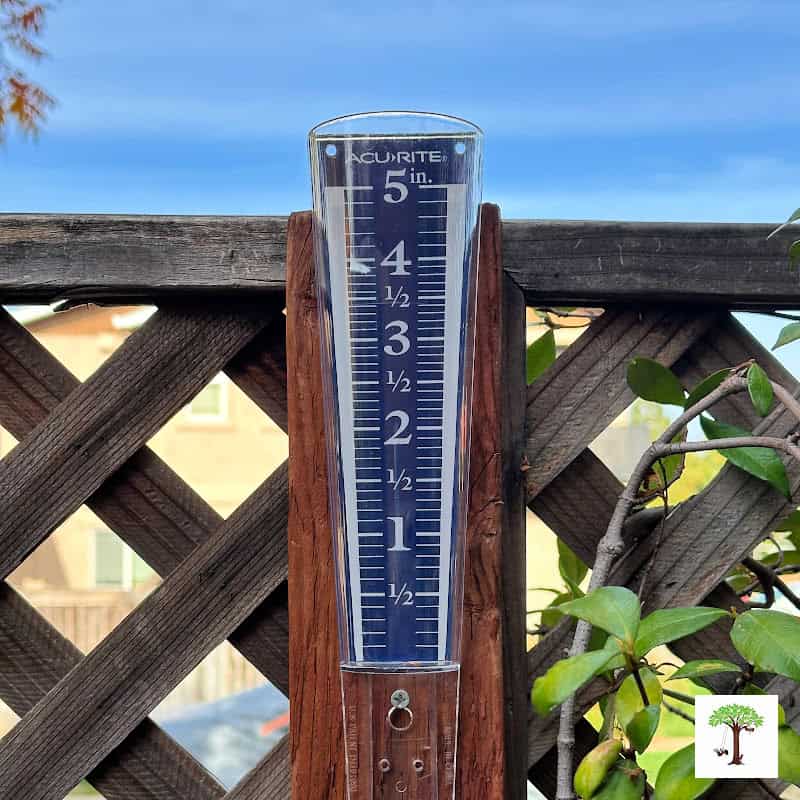
Read its marked rainfall scale instead of measuring water depth with a ruler. Unlike the straight-sided homemade option below, this shaped gauge (shown in the photo above) uses a calibrated scale. Follow the measuring and recording steps below to use it with your monthly rainfall graph.
How to Make a Homemade Rain Gauge
You can also measure rainfall with a simple homemade rain gauge. This option gives children a hands-on way to collect rain using a container and a ruler.
Homemade Rain Gauge Supplies
- A clear, waterproof container with straight sides and a flat inner bottom (a curved bottom can skew results)
- A ruler marked in millimeters or inches
- Waterproof tape
- A notebook, binder, or printable rainfall graph
Choose your container carefully: The opening must be the same width all the way down. Avoid jars with narrow necks, tapered drinking cups, and containers with raised or rounded bottoms. A straight-sided container allows you to measure the collected water’s depth directly.
Make and Use Your Rain Gauge
- Clean and dry the container. Remove the lid and any labels that would make the water level difficult to see.
- Attach the ruler. Tape the ruler vertically to the outside, aligning its zero mark with the flat inside bottom—not the underside of the container. If the ruler has an unmarked section below zero, let that section extend below the container.
- Find a collection spot. Place the gauge upright on a level surface, with nothing overhead, so rain can fall into it freely. Keep it away from sprinklers, roof runoff, and overhead branches to keep its opening unobstructed. Make sure it is secure so it cannot tip or be knocked over by wind, rain, or your dog.
- Measure the collected rain. Check it at the same time each day. Bring your eyes level with the water and read its depth using the ruler. If you pick it up, let the rainwater settle before measuring. Record the amount on your rainfall graph.
- Empty and reset. Empty the container after each reading and return it to the same spot for the next observation. Check, measure, record, and empty your homemade gauge daily.
Keep the ruler, stones, and other objects outside the container. Objects inside displace water and change the relationship between collected rainfall and water depth. If needed, use an outside support to hold the gauge steady instead.
When using the printable graph to record rainfall measurements, use the smallest unit of measurement you can confidently read on the ruler. Color part of a graph space when the amount falls between its lines.
Choose Your Monthly Rainfall Graph
The set includes four recording sheets:
| Rainfall graph | Scale | Each space represents |
|---|---|---|
| Everyday rainfall in inches | 0–4 inches | 0.1 inch |
| Everyday rainfall in millimeters | 0–100 mm | 2 mm |
| Heavy rainfall in inches | 0–20 inches | 0.5 inch |
| Heavy rainfall in millimeters | 0–500 mm | 10 mm |
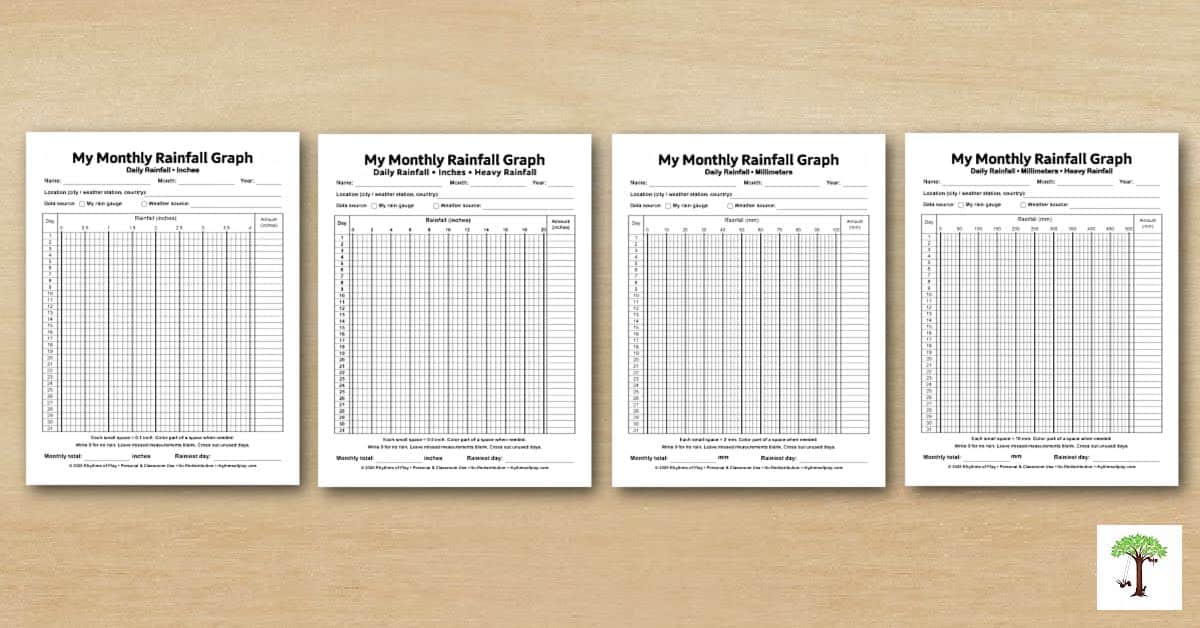
Choose a scale that leaves room for the daily amounts you expect to record. Areas where more rainfall is expected will most likely require the heavy rainfall graphs, while areas with low precipitation can use the everyday rainfall graphs.
The everyday graphs give smaller measurements more room, while the heavy-rainfall graphs accommodate larger daily totals. Use the same scale throughout the month so bar lengths stay comparable.
The inch and millimeter sheets are separate options with convenient coloring increments; they are not exact conversions of one another.
How to Measure and Record Rainfall
Follow the steps below to measure, record, and graph rainfall where you live.
1. Prepare Your Graph
- Print your chosen sheet at Actual Size or 100%. Add your name, month, year, and location.
- For the location, include your city and country or the name of the weather station you will use.
- Mark whether your measurements will come from your own rain gauge or another weather source.
- Cross out days that are not part of the month. For example, cross out day 31 when recording April’s rainfall.
2. Set Up Your Rain Gauge if You Will Be Using One
Follow the instructions for your gauge. Choose a place where rain can enter freely, away from roof runoff, sprinklers, and overhanging branches. Secure the gauge upright with its opening level.
Nearby obstructions and wind can affect how much rain it catches. The Bureau of Meteorology explains rain-gauge placement and setup. Keep the gauge in the same place for each observation.
3. Choose a Daily Observation Time
Check the gauge at about the same time each day, even when it has not rained, to create the habit, or daily rhythm, of completing the activity daily. Otherwise, you might forget to check it, record the rainfall amount, and dump it when it rains.
A consistent routine helps you compare measurements collected over similar periods and helps increase accuracy. Write your observation time in your nature journal or on the back of the graph.
For this activity, use the date you take the reading. A morning measurement includes rain collected since the previous morning; it is not necessarily the rainfall for a midnight-to-midnight calendar day.
4. Read and Record the Amount of Rain
Check the gauge only when conditions are safe. Wait indoors during dangerous weather.
Read the gauge according to its instructions. For a graduated measuring tube like ours in the photo below, bring the water surface to eye level and read the bottom of the curve. We have it mounted on a fence post at eye level, which makes this task easy. See the Bureau of Meteorology’s measuring guidance.
Write the measured amount in the Amount column beside the observation date. Keep the units consistent. Record inches on one of the inch graphs (everyday or heavy), or millimeters on one of the millimeter graphs (everyday or heavy) included in our printable set.
After recording your reading, empty and reset the gauge according to its instructions so the next observation starts a new collection period. The National Weather Service provides additional rain-gauge reading tips.
5. Color the Daily Bar on your Printable Rain Graph
Find the day’s row and begin coloring at the zero line. Color across to the measured amount. For example:
- On the everyday millimeter graph, 8 mm fills four spaces.
- On the everyday inch graph, 0.4 inches fill four spaces.
- On the heavy-rainfall millimeter graph, 50 mm fills five spaces.
- On the heavy-rainfall inch graph, 2 inches fill four spaces.
Color part of a space when needed. The written amount preserves the measurement even when the colored bar is approximate. The narrow areas between the double lines at the graph’s ends are borders, not additional measurement spaces.
My Daughter’s Monthly Rainfall Graph Page
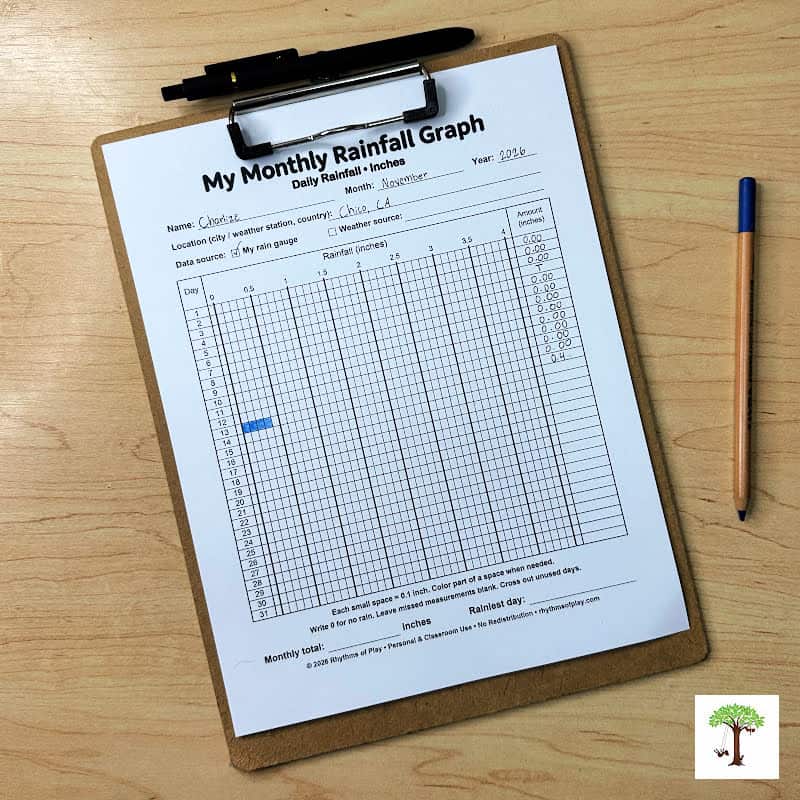
My daughter recorded the rainfall amount using the Printable Monthly Rainfall Graph for everyday rain in inches. She used a blue colored pencil to mark the graph up to the 4th mark on November 13th, just below 0.5 inches, to match the 0.4-inch amount we recorded in our rain gauge shown in the photo above. You can see her graph page recording in the photo below.
Because rainfall can vary noticeably from the north end to the south end of town, local agencies and news outlets use a combination of private meteorological networks, university agricultural stations, and federal weather services rather than a single citywide rain gauge to track results. They recorded 0.78 inches of rain that same day, which, as you can see, differs significantly from what we recorded in our home rain gauge.
Because of this difference, we decided to use another Printable Monthly Every Day Rainfall in Inches Graph page to track the results from these combined agencies so we could compare them with the amounts we record in our rain gauge throughout the month and for the remainder of the rainy season.
In our town, this typically lasts well into spring and sometimes into late spring. With this year being a Super El Niño year, our recordings and comparisons will likely be very interesting. We might even need to use the heavy rainfall page at some point. Join us to see what you discover!
What If There Is No Rain—or You Miss a Day?
No rain: Write 0 or 0.00 in the Amount column and leave the bar uncolored. You can see that my daughter recorded 0.00 on each day there was no rain on her Monthly Rainfall Graph in the photo above.
A trace of rain: If rain occurred but the amount was too small to measure, record T for trace. A trace is different from no rain because, while it may have rained a bit, no rainwater is present in the rain gauge.
For example, my daughter recorded a T for the trace amount of rain we received at our home on November 4th in the photo above. We had a few short periods of light rain that day, but no measurable amount of rainwater to record in our rain gauge.
A missed observation: Leave the daily amount blank rather than writing zero. If the gauge contains rain collected over several days, use a bracket to note the amount and date range separately. Do not assign the whole amount to one day or divide it equally among the missed days.
Rainfall beyond the graph’s scale: Write the full amount in the Amount column. Color to the end of the scale and add a small arrow to show that the amount continues beyond it.
Use Weather Data to Explore Rainfall Anywhere
You do not need your own rain gauge to use these printables. You can also choose a weather station or location with available daily rainfall records. Look for a national weather service, meteorological agency, or an established observation network.
One source to explore with children is the CoCoRaHS precipitation map, which shows measurements collected by community weather observers. With an adult’s help, choose a station with regular daily reports and use its measurements to fill in your graph.
Because these reports can include melted snow and other frozen precipitation, choose rain-only observations for this rainfall activity. Use observed rainfall amounts, rather than the forecast chance of rain. Record the station name and source on your sheet, then use that same source throughout the month.
Check what period each reported amount covers. Depending on the source you use, some daily reports cover the previous 24 hours ending in the morning rather than a calendar day. Follow the source’s date labels consistently and note its reporting period.
Also check whether the source reports rainfall specifically or total precipitation, which may include the water equivalent of snow and other frozen precipitation.
You can also make separate graphs for two locations during the same month to compare and contrast. Use the same units and scale if you want to compare the bars directly.
Look Back at Your Month
At the end of the month, use the graph to talk about what happened:
- Which day had the most recorded rainfall?
- How many days had measurable rain?
- How many days had no rain?
- What was the longest stretch of dry days?
- Did several small showers add up to more rain than one wetter day?
- What new questions would you like to investigate?
Find the largest recorded daily amount and write its date in the Rainiest day space. If several days tie, record each date.
Add the written daily amounts to find the total. Use the numbers in the Amount column rather than estimating from the colored bars.
If observations are missing, label your result as a total for recorded days. If any entries are marked T, note that trace amounts occurred rather than treating them as measured quantities.
Younger children can help read, count, and color with an adult. Older children can add totals, compare locations, or calculate an average for the days with measurements.
Record Rainfall in a Nature Journal or Notebook
A nature journal gives children a place to record rainfall measurements alongside other outdoor discoveries. Use one instead of the printable graphs, or combine the two to keep measurements and observations together.
To track rainfall without a printable, write the date, location, and measured amount in your journal each day. Leave room for notes or drawings about the clouds, puddles, plants, and other changes you notice. You can also draw your own rainfall graph.
To use the printables with a nature notebook, use a three-hole punch to add the monthly rainfall measurement pages to a three-ring binder. Include lined, blank printer paper, or cardstock for recording nature observations, sketching discoveries, and writing questions to explore.
Try adding a few notes beside each day’s measurement:
- What did the sky look like?
- Was the rain gentle, steady, or brief?
- Where did puddles form?
- What changed in your yard, garden, or your favorite outdoor spot?
- What would you like to observe next?
Keep your rainfall graph near the notes for that month so children can look back at the measurements and observations together.
Get the Monthly Rainfall Graphs
Choose from four printable sheets in inches and millimeters, with everyday and heavy-rainfall scales.
Each sheet includes:
- Days 1–31 for use in any month
- Name, month, year, and location fields
- A place to identify your rainfall source
- A coloring graph and daily amount column
- Spaces for the monthly total and rainiest day
Use the graphs at home or with the students you personally teach, following the Personal & Classroom Use terms included with the printable set.
See What the Rain Reveals
A rain gauge, a few minutes each day, and a place to record your observations can turn rainy weather into an ongoing discovery. Use the printable rainfall graphs, keep notes in a nature journal, or combine both to explore the rain where you live—or somewhere you’re curious about.
Recording measurements and coloring the graph is a fun activity for homeschoolers and classroom students. It also makes a great addition to your nature journal. Over time, daily measurements become a record children can revisit, compare, and use to ask new questions. How much rain will the next month bring?
For more ideas, explore these fun Rainy-Day Activities for Kids.
Learn more about Rhythms of Play on our About page, or meet the creator and author, Nell Regan Kartychok.





Leave a Comment